A number is only useful if you know where it comes from. "Macro 69%" means nothing until you know what was measured, what it was compared with, and why. This guide opens the box: every rating in Repalyzer, the exact formula behind it, and the games its benchmarks were built from.
It is written for players who like to check the maths. If you just want to use the numbers, Your first replay review in 10 minutes and How do you stack up against the pros? are the better place to start.
Two sources of truth
Every number in Repalyzer comes from one of two places, and each card says which with a small source badge.
- Commands. What the player clicked, read straight from the replay file: APM, hotkeys, the action breakdown, the event log. These work without StarCraft installed.
- Simulation. What actually happened on the map. Repalyzer replays the game in a copy of the Brood War engine and records the state of every player once per game second: money in the bank, minerals gathered, workers, idle workers, supply, production buildings busy or idle, larvae, damage dealt and taken. Everything below except APM and hotkeys is built from these per-second records.
One game frame is 42 milliseconds, so timings from the simulation are exact to the frame.
One principle runs through all of it: one definition everywhere. A supply block on the chart, in Game at a glance, in the Opportunity report and inside the Macro rating is the same supply block, by the same rule.
The building blocks
Four simple measures feed almost everything else. Each has one fixed definition.
APM and effective APM. The main APM figure leaves out the first 100 seconds, when players spam-click to warm up (often 300+ APM when about 10 clicks are needed). BWChart cuts about the first 2 minutes instead, and divides by the time to the player's last action, which is why the two never quite agree. Effective APM uses the same window but counts only actions that can change the game, by the rules of the SCREP replay analyzer: fast repeats of the same command, selections replaced within a few frames, and null actions are left out.
A null action is an order that achieves nothing: an order given with nothing selected, or the same order to the same units at the same place (within 2 tiles, each within 3 seconds of the last) for the third time or more. The first click and one confirming click are fine. Orders the game refused, such as training without enough minerals, are added once the simulation runs.
Supply blocks. A second counts as supply blocked when you are at your supply cap, below 200, for 2 seconds or longer in a row, from 1:30 on. The 1:30 start means the normal wait at 9 supply in every opening is not a block. Time at 200 supply is never a block, because nothing more could be built anyway.
Idle workers. Every second, the simulation counts how many of your workers have nothing to do. Idle workers is idle worker-seconds divided by all worker-seconds. Ten workers idle for 6 seconds and one worker idle for a minute both add 60 worker-seconds.
Hotkey share. HotKey actions (assign, add and recall) as a share of all your actions.
Macro and Micro on the Actions tab
The two rating cards on the Actions tab are absolute scores from 0 to 100%. They describe this one game and can be compared between any two games, yours or anyone's. Each is a weighted average of a few parts, and the card lists every part so you can see why the number is what it is.
Macro has three parts:
| Part | What it measures | Weight |
|---|---|---|
| Production | Protoss and Terran: the share of time your finished production buildings spent producing. Zerg: the share of hatchery time not sitting at 3 larvae, when larva spawning stops. | 50% |
| Supply | The share of seconds from 1:30 you were not supply blocked | 25% |
| Spending | From 2:00: income per minute ÷ (income per minute + average money in the bank) | 25% |
A few details make Production fair. Bases count for Protoss and Terran only while you would normally be making workers: until 15:00, or until you first reach 64 workers, whichever comes first. Seconds at 200 supply are left out. Seconds spent supply blocked count as idle, since nothing could be made.
Spending rewards money spent as it arrives. With an income of 2,000 a minute and an average of 500 in the bank, Spending is 2,000 ÷ 2,500 = 80%. Float 2,000 on the same income and it drops to 50%.
Here is Light vs Soma from the live demo. Soma won.
Light's Macro is (2 × 51.4 + 95.8 + 76.5) ÷ 4 = 68.8%. Light rarely got blocked but left production buildings idle for half the game. Soma was blocked for a quarter of it, yet hardly ever let larvae pile up.
Micro has two parts, averaged evenly:
- Damage traded: damage you dealt ÷ (damage dealt + damage taken).
- Units traded: the value (minerals + gas) of enemy units you killed ÷ (killed + your own units lost). 1-on-1 games only.
Micro needs real fighting before it says anything: at least 600 damage dealt and taken in total, and 400 in unit value traded for the second part. Spawned and free units (larvae, Interceptors, Scarabs, Spider Mines) have no value. The card also shows the time spent in big fights, any second with 150 damage or more.
In the same game Light's Micro is 54% (47.1% damage, 60.9% units) against Soma's 45.6% (52.0% and 39.1%). Light won the trades and still lost the game. That is the point of the warning on the card: Micro is a fight result, and a bigger army wins fights too. Read it next to Macro, never on its own.
The Macro rating on the Overview: you against yourself
The Macro rating on the Overview answers a different question: was this a good macro game for you? It shows two numbers.
- The measured value, such as "Production uptime 71%" ("Larva use" for Zerg). This is the Production part from the Actions tab alone, over the whole simulated game, without Supply and Spending.
- A rating from 0 to 100 that places this game among all your games in the same matchup. Your worst game scores 0, your best 100, and the rest sit in between in a straight line.
The formula is rating = 100 × (this game − your worst) ÷ (your best − your worst), counting this game too. Say your PvZ games range from 58% to 79% production uptime. A game at 72% rates 100 × 14 ÷ 21 = 67.
A few things follow from that.
- It needs at least 2 games. With exactly two, one scores 100 and the other 0. The rating means more with every game you add.
- It moves. A new best game scores 100 and quietly lowers the rating of every older game. One freak game at either end stretches the scale for all the others.
- It counts all your names. Games are matched through Known Players, so your smurf and your main account share one scale.
- It is never "good" or "bad". Repalyzer only says whether a game was usual for you. The same wording appears next to key timings: "31 seconds earlier than your usual ZvT".
So the two Macro numbers do different jobs. The Actions tab card is absolute: compare it with anyone. The Overview rating is personal: it tells you whether you beat your own standard. A 70% production uptime can be your best game ever and still sit well below the progamers on the Skill shape.
The Skill shape: where 0 and 10 come from
The Skill shape turns five values into scores from 0 to 10, so that very different things (a percentage of actions, an APM, a share of worker time) fit on one pentagon.
| Corner | Value | Better |
|---|---|---|
| Micro | The Micro card from the Actions tab | Higher |
| Speed | Effective APM after the 100-second warm-up | Higher |
| Hotkeys | Hotkey share of all actions | Higher |
| Idle workers | Idle worker-seconds ÷ all worker-seconds | Lower |
| Macro | The Macro card from the Actions tab | Higher |
Each corner has two fixed points. 10 is the level of the best 10% of progamer games for your race in your matchup. 0 is the floor: 0% for Micro and Hotkeys, 50% for Macro, 50 effective APM for Speed. For Idle workers the floor is per race: the level that the worst 5% of low-rank ladder games (D, E and F) reach, which is 14.3% for Terran, 12.5% for Protoss and 8.7% for Zerg.
Between the two points the score follows this formula:
score = 10 × ((value − floor) ÷ (top − floor))0.8kept between 0 and 10
The power of 0.8 is a slight lift. A value exactly halfway between floor and top scores 5.7 instead of 5.0. The lift is largest in the lower middle, about +0.8 points around a score of 3 to 4, and fades to nothing at 0 and 10. It keeps an honest ladder game from looking hopeless next to a progamer's.
These are the tops, the values that score 10. They are the 90th percentile of progamer games (for Idle workers, the 10th).
| Matchup | Micro | Macro | Hotkeys | Idle workers | Speed (effective APM) |
|---|---|---|---|---|---|
| PvP | 62.6% | 81.3% | 56.9% | 1.1% | 266 |
| PvT | 60.3% | 81.5% | 55.7% | 1.7% | 264 |
| PvZ | 64.8% | 81.2% | 56.2% | 1.8% | 284 |
| TvP | 65.5% | 79.6% | 55.2% | 2.8% | 251 |
| TvT | 65.5% | 83.3% | 59.8% | 2.3% | 243 |
| TvZ | 66.8% | 80.3% | 55.3% | 2.4% | 264 |
| ZvP | 58.0% | 91.2% | 55.3% | 0.3% | 266 |
| ZvT | 61.8% | 91.7% | 57.2% | 0.4% | 277 |
| ZvZ | 61.2% | 91.2% | 60.7% | 0.1% | 282 |
Worked example. Light's Macro in Light vs Soma is 68.8%, in TvZ. The floor is 50% and the top 80.3%, so Light covered (68.8 − 50) ÷ (80.3 − 50) = 0.62 of the distance. With the lift, 0.620.8 = 0.68, a score of 6.8. Light's idle workers were 9.6% of worker time, against a Terran floor of 14.3% and a TvZ top of 2.4%: (14.3 − 9.6) ÷ (14.3 − 2.4) = 0.39, which lifts to 4.8. Both match the Game card.
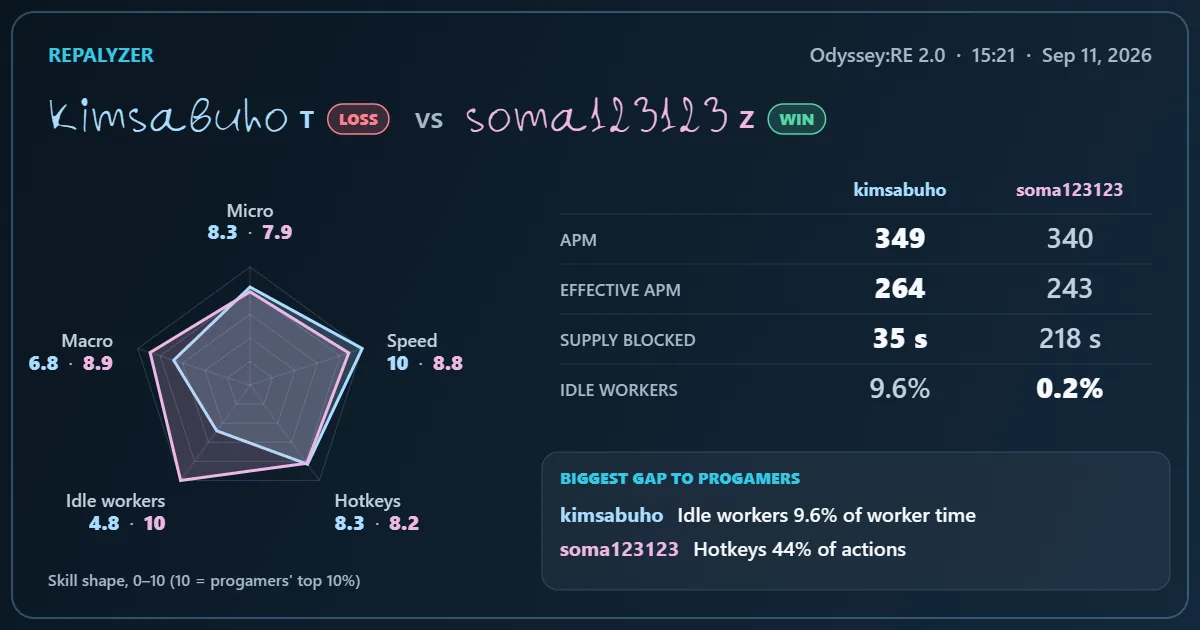
Two more rules keep the comparison fair. With Adept on, your shape and the Adept's are measured over the same whole minutes, so a 12-minute game is not compared with the late game of a 30-minute one. And the Skill shape is 1-on-1 only: team games are played too differently to share a scale.
What 5,287 games say about progamers and the rest of us
The scale was built from two sets of games, all 1-on-1, 7 minutes or longer, with the simulation verified for at least 7 minutes:
- 4,905 progamer player-games from a library of Korean and foreign progamer replays, the same kind of games as the pro packs. Games against the computer and Random players are left out.
- 382 ladder player-games from players ranked D, E and F on the StarCraft: Remastered ladder in October 2026 (208 Terran, 88 Protoss, 86 Zerg), downloaded from the current season's leaderboard.
The ladder games set the Idle workers floor. They also show where the real gaps are. Here are the typical (median) values of each group, across the nine matchups.
| Corner | Progamers | D/E/F ladder | Typical score, pros / ladder |
|---|---|---|---|
| Speed (effective APM) | 210–237 | 102–137 | 8.1–8.7 / 3.0–5.1 |
| Hotkeys (share of actions) | 44–51% | 17–30% | 8.3–9.0 / 3.9–6.0 |
| Macro, Protoss and Terran | 73–78% | 64–71% | 7.8–8.6 / 5.1–7.2 |
| Macro, Zerg | 87–88% | 80–84% | 9.2–9.4 / 7.7–8.6 |
| Idle workers, Terran | 4.9–5.3% | 6.8–7.3% | about 8.2 / 6.5–7.1 |
| Idle workers, Protoss | 2.5–4.1% | 5.7–6.8% | 8.2–9.0 / 6.0–6.9 |
| Idle workers, Zerg | 0.3–1.2% | 0.7–2.4% | 9.2–9.8 / 8.0–9.5 |
| Micro | 34–65%, by matchup | about the same as pros, matchup by matchup | 7–9 / 7–9 |
What stands out:
- The typical progamer scores about 8, not 10. Ten is the best 10% of progamer games. If you hit 10 in a corner, you played that part of the game like the best pros do on a good day.
- Hands are the biggest gap. Progamers make nearly twice as many effective actions a minute, and about twice as large a share of them are hotkeys. Hotkeys are also the cheapest of the five to fix: it's not a talent, just a habit that you need to practice in order to excel.
- Macro is closer than you might think. A D/E/F Terran keeps production busy about 65% of the time; a progamer about 74%. Those 9 points are the difference between a 5 and an 8.
- Zerg is different. Larva use runs far higher than production uptime, and Zerg leaves very few workers idle: progamers in ZvZ sit at a median of 0.3%. That is why the scale is set per race and matchup, and why Zerg scores high on Idle workers at every level.
- Micro separates matchups, not levels. A D/E/F player trades about evenly with a D/E/F opponent, just as a progamer does with a progamer. What moves it is the matchup: in a typical PvZ the Protoss deals 65% of the damage, and in a typical ZvP the Zerg deals only 34%. Micro shows how this game's fights went against this opponent. That is why it stays on the shape but is never picked as your One thing to fix.
The D/E/F sample is small in some matchups (7 ZvZ games, 15 PvP), so treat those ladder figures as rough.
How One thing to fix chooses
One thing to fix is the Skill shape put to work. It looks at four corners: Macro, Idle workers, Hotkeys and Speed. Micro is left out for the reason above: it shows how the fights went, not something you can practise on its own.
- Find your usual games. Repalyzer looks for at least 5 of your simulated 1-on-1 games in the same matchup that last at least as long as this one. If too few do, it shortens the window, down to 4 minutes, until 5 games cover it. Every game is then measured over exactly those minutes.
- Score this game and your usual average on the Skill shape scale.
- Pick the biggest drop. The corner where this game fell furthest below your usual, by 0.3 points or more, is the one to fix.
- No drop, or too few games? Then it picks the corner furthest from the progamers instead, and the card says "Biggest gap to progamers".
The card then says what happened, not what it might have cost. For Idle workers it names the worst minute. For Macro it names the weakest of the three parts: the supply block with its worst minute, production buildings busy only part of the time, or the average money left unspent. Each figure is shown next to your usual value and the best 10% of progamer games. Nothing is estimated or added up, as in the Opportunity report.
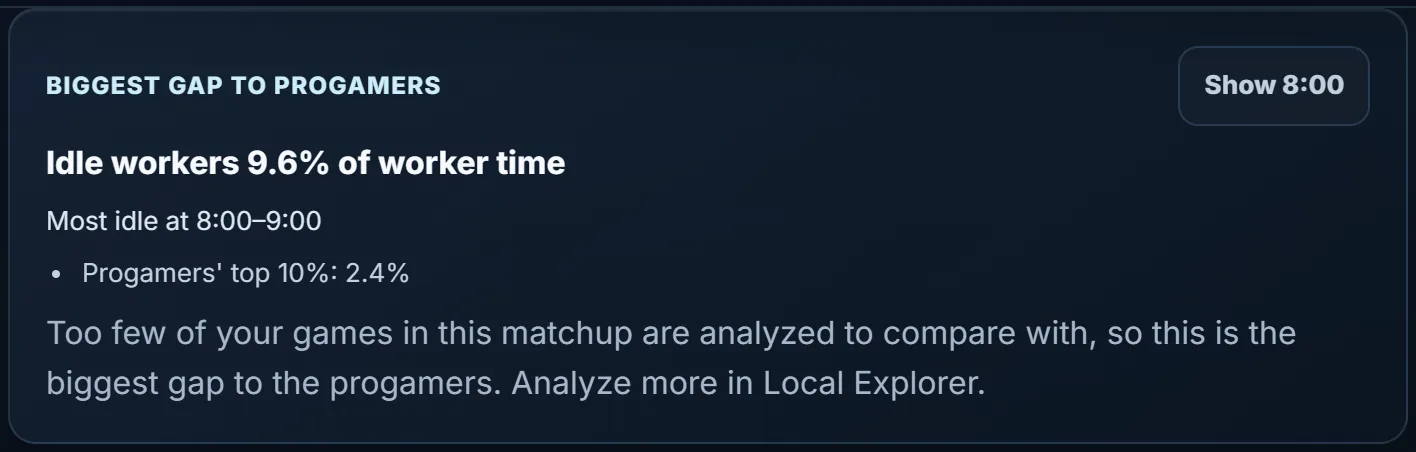
That is what happened in Light vs Soma. Too few of Light's games were in the library, so the card compared with progamers. Idle workers scored lowest (4.8), so the card read "Idle workers 9.6% of worker time, most idle at 8:00–9:00. Progamers' top 10%: 2.4%".
The Initial split: the first minute, frame by frame
The Initial split card judges how well your four starting workers mined. It is the one card measured to the frame (42 ms), because the simulation records the first minute event by event rather than once per second. It is scored 0 to 100 from two halves.
First 32 minerals (half the score). Four workers each bringing back their first 8 minerals makes 32. The card times how long that takes from the start of the game: 100% at 8.00 seconds or sooner, 0% at 12.00 seconds, and a straight line between. At 8.69 seconds you get 83%; at 11 seconds, 25%. This half shows how cleanly you sent the workers out.
Minerals by 1:05 (the other half). The minerals mined in the first 65 seconds, the starting 50 not counted. This covers the split and the first workers you built, and it is compared with the best progamers at the same spawn position on the same map. Every worker trip (8 minerals) below them costs 10%. Match them or beat them and this half is 100%.
"The best progamers" is the top 10% of 2,920 progamer 1v1 games at that spot. If fewer than 5 games were played there, Repalyzer steps back until it finds enough:
- Progamers at this map and this clock position, for example "Octagon, 11 o'clock".
- Progamers on this map.
- Progamers at this clock position on maps with the same number of start locations.
- Progamers on standard maps.
Small groups are also blended with the group above them, with the weight of 10 players, so one lucky game at a rarely played spawn cannot set the bar. The card names the benchmark it used.
Races mine differently in the first minute. On standard maps the best Protoss and Zerg players reach 424 minerals by 1:05, the best Terrans 400. So the benchmark is lowered by 24 minerals (three trips) for Terran.
Here are both halves for the demo games.
| Player, spawn | First 32 | Score | By 1:05 | Best pros | Score | Initial split |
|---|---|---|---|---|---|---|
| Snow (P), Octagon 7 o'clock | 8.23 s | 94% | 408 | 426 | 78% | 86 |
| Speed (T), Octagon 11 o'clock | 8.82 s | 80% | 384 | 408 | 70% | 75 |
| Light (T), Odyssey:RE 1 o'clock | 7.27 s | 100% | 608 | 656 | 40% | 70 |
| Soma (Z), Odyssey:RE 7 o'clock | 6.93 s | 100% | 696 | 680 | 100% | 100 |
Snow was 18 minerals short, 2.25 trips, so lost 22.5% on the second half. Light had the fastest first trips of the four and still scored only 70: by 1:05 Light was 6 trips behind the best progamers at that spawn. Odyssey:RE shows why the benchmark is per map. Its mineral lines are so close that progamers mine a median of 616 there by 1:05, against about 408 on standard maps.
The card also shows two times for reference: All mining, when the last starting worker was sent to minerals (Light 0.71 s, Soma 0.55 s), and First worker, when your first new worker started (Light 0.46 s, Soma 0.92 s).
A few facts from the progamer data:
- The median progamer takes about 9.0 seconds for the first 32 minerals; the fastest 10% about 8.3 to 8.6 seconds. Scoring 100% on that half is genuinely hard on a standard map.
- On standard maps the median progamer mines 408 minerals by 1:05 as Protoss, 416 as Zerg and 384 as Terran.
- Maps differ more than you might think: the best progamers reach about 416 on Fighting Spirit and 431–432 on Octagon, Backrooms and KnockOut. That is two trips from the map alone.
- Spawns differ too. On Fighting Spirit, the best and worst start locations are 16 minerals apart, again two trips.
When the simulated part of a game ends before 1:05, only the first half is scored.
Odds and ends for the curious
- Floating money in the Opportunity report starts at the larger of 600 minerals / 400 gas or 30 seconds of your income, held for 30 seconds or more from 4:00. On 4 bases at about 2,400 a minute, that is 1,200 minerals. Big fights and the 8 seconds after them are ignored, since nobody macros mid-fight.
- Late workers are measured against your usual games, or, without them, a standard curve: one worker at a time from each finished base, up to 64.
- Units are counted the way StarCraft counts them. Starting workers count as produced. Spider Mines and Interceptors count; Scarabs do not. A Lurker or Guardian replaces its source unit, and an Archon replaces its two Templar, which are not counted as lost.
- Personal bests (highest APM, earliest expansion) appear only once you have at least 3 other games in the matchup, so your second game ever cannot be a "record".
- No winner in the replay? Some replays carry no leave-game records. Then Repalyzer looks at the end of the simulation and names a winner only when one player is clearly ahead on supply.
- Where the simulation stops matching the game (it can drift in rare cases), every simulated number stops there too, and the cards say "up to mm:ss". Command-based numbers carry on to the end.
Practice task
Open one of your own recent games and check Repalyzer's maths by hand. Take the three Macro parts from the Actions tab, weight them 2, 1 and 1, and confirm the Macro figure. Then use the tops table above to work out your Macro corner on the Skill shape, and compare it with the Game card. Once the numbers make sense, pick the corner where you are furthest from your matchup's top and make it your focus for the next ten games.